Justin King @Justinkingnews Headline: "Women who own horses live longer" Implied correlation: horses make you live longer. Reality: if you own a horse, you can probably afford health insurance.
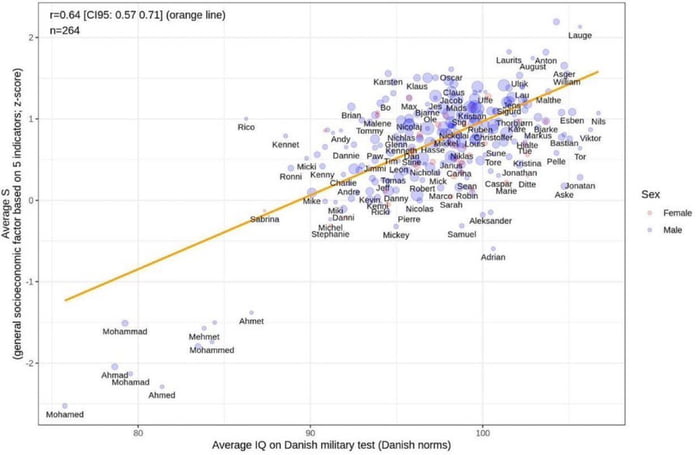
Scatter plot with an orange regression line. It notes r = 0.64 (with 95% CI around 0.57 to 0.71) and n = 264. The x-axis is labeled 'Average IQ on Danish military test (Danish norms)' and the y-axis appears to be another related metric (possibly 'Mean... (scale in thousands?)' though the full label is unclear). Numerous data points are plotted by c
Memes Today – is an entertainment platform built primarily on Android and iOS mobile apps. In order to use the full functionality of Memes Today, we ask you to download the mobile application available from the links below. By downloading the App, you can like, comment, save posts to favorites, share the content.